There are several important Fibonacci levels for the trader,
he has to take into account, and one of the most important of these levels is
88.6% retracement level. Where the retracement level 88.6% is derived by taking
the "average" Golden 0.618, and the square root of his collection,
and the collection of the square root of the product, to reach 0.886. Now, when
I say that this is the rate of decline of 88.6% Fibonacci "All I mean is
that the decline is 88.6% of the initial volume of movement. If the initial
move by 100 points higher, will be rolled back by 88.6 points down.
Fibonacci levels are not biased to any specific time frame,
as have the same shelf life, whether you're looking at a graph (table) Weekly
long-term or short table for 5 minutes.
Let's start with a weekly Graph of the U.S. dollar against
the Swiss franc (USD / CHF).
Fibonacci and Forex U.S. dollar / Swiss franc
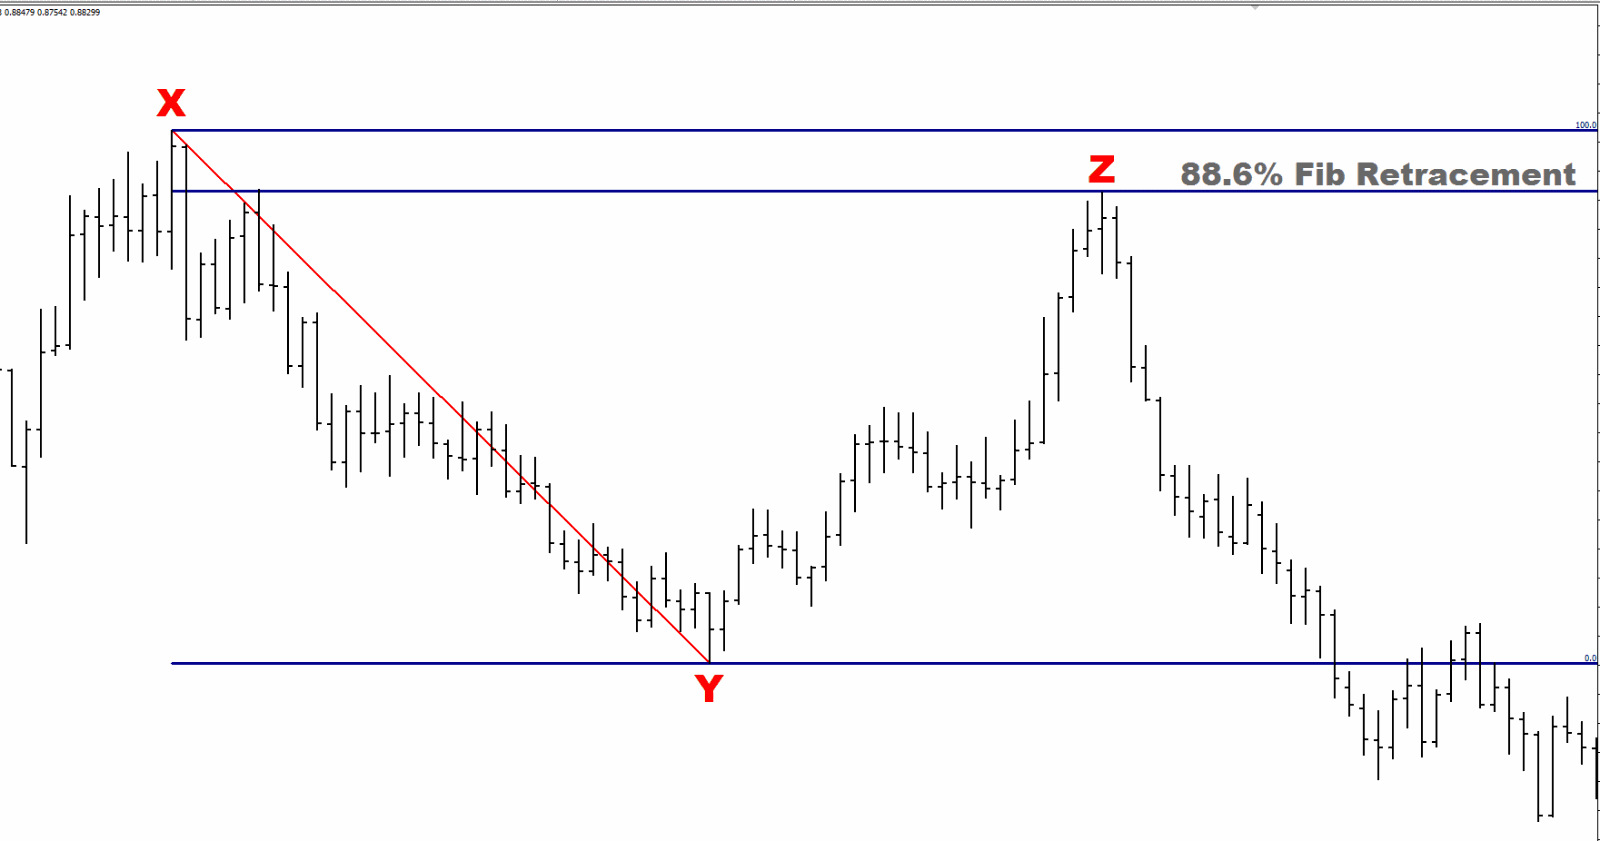
Price rose early to point X at 1.1967 on March 8, 2009, then
moved down to the low point Y at 0.9909 on November 22, 2009. If the price
moves up 2,058 points during the 37 weeks. Price then retreated to point Z at
1.1730, (or 1,821 points) on May 30, 2010, after 28 weeks after point Y. When you check in the table and figures,
it was back to within two points of the 88.6% level. This is terrible because
the price moved thousands of points over many weeks and months, and with this,
it was able to achieve this exact figure for a key Fibonacci levels.
the Selecting of this
level and a clear vision of the strike may be due to rolling over 1,000 points
if it decided to move with the price
down after the retreat ended at the point Z. (If you enlarge the image on the
drawing, you will also be able to see that the move was part of a pattern of
descending a long-term USD / CHF, which is constantly in fact to this day).
Instead, with the knowledge that it has been examined and taken Fibonacci
levels main accurately and success, the trader can take a number of trades on
the fee short schedules, such as chart four hours and graph time, looking for
points of entry to sell the U.S. dollar / franc Swiss. Log on shorter time
frames with the use of long-term levels, allows narrower stop loss points, and
rates of risk / profit for the better trades.
Likely target for the trading process could be the beginning
of the decline or point Y or 100% extension of the initial motion, which will
be shortly after the point Y.
Let's now look at the actual trading process you've made on
the GBP / USD on the agenda of this 15 minutes:
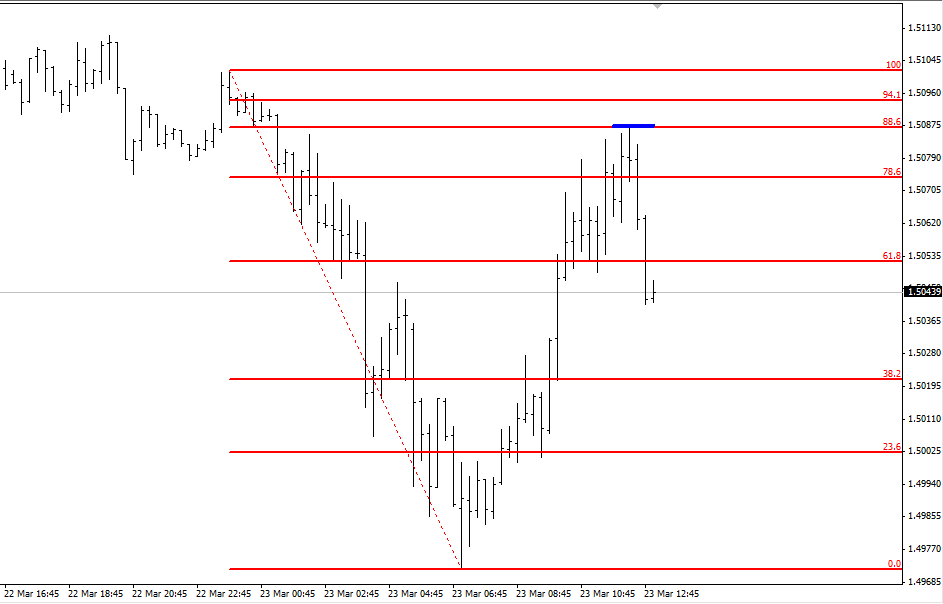
Fibonacci graph of the 15 minutes in Forex:
I saw that the price was a test level of 88.6%, as is
evident from the little blue line on the table. (Thus, it was already an
official appears when I was trading). But I did not enter directly. The price
has already moved quickly, and I am worried about where you will put the stop
loss points for me.
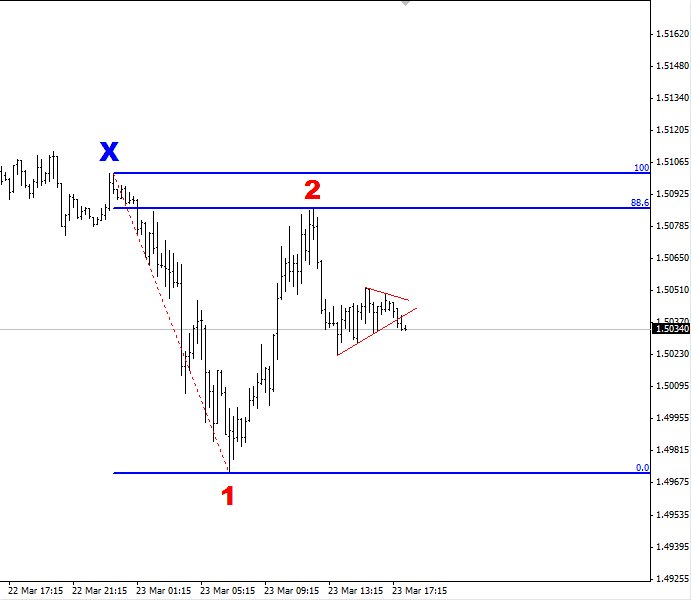
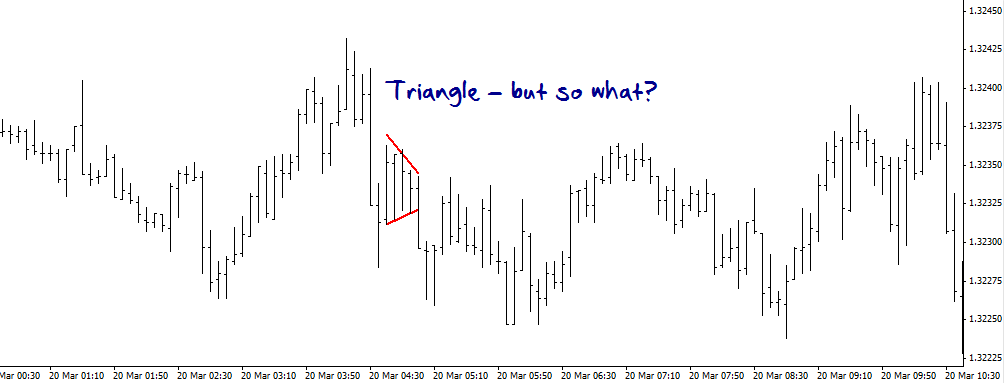
I continued to monitor the charts and the price moves
towards the good strengthening, or pattern both sides of the
"triangle", distinguished by red lines:
Triangle pattern
This enabled me to enter the circulation and tight stop
losses just above the triangle, rather than stop the biggest points above the
88.6% level. This gave me the best rate for risk / returns to the trading
process, including more than 1:3. In other words, the profit target is greater
than 3 times the stop loss point.
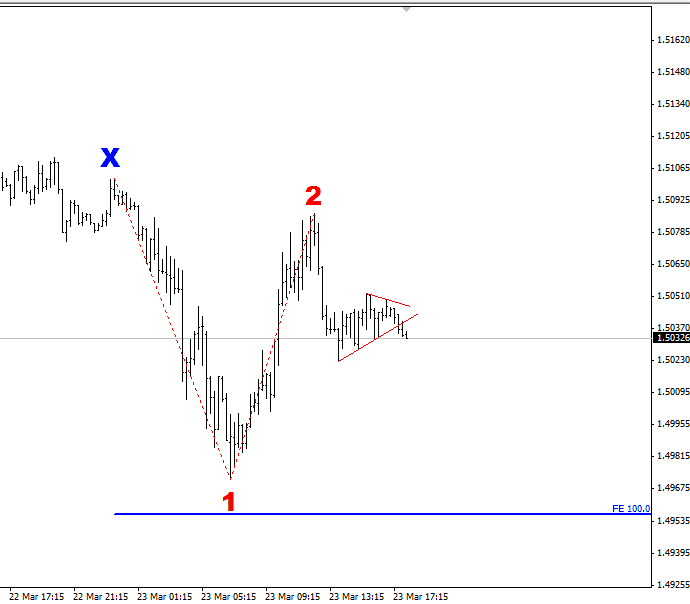
In this trading particularly, I used 100% extension of the initial movement
as a profit target. In short, this means that I took the volume of
movement from point X to point 1, and
your measured down of 2 point, and it shows in the bottom blue line in the
following chart:
Fibonacci extension 100% in Forex:
The following graph shows how the trading process unfolded:
Fibonacci trading results
Price moves down and reached the profit target after a few
hours. The breakpoint losses shortly after 20 points, and the profit target is
80 points.
Abstract:
1. Fibonacci levels can be applied on long tables and
short-term.
2.it Can be traded using Fibonacci with other indicators and
patterns of other tables.
3. Fibonacci retracement level of 88.6% is particularly
strong for trading him alone.


Knowledge giving Article! I appreciate you. I completely agree with you. If we talk about current scenario then it is must be update. I enjoyed reading. I would like to visit more for more queries.
ReplyDeleteforex trading system