In this presentation I would like to show one simple way to
recognize profitable trades, and eventually avoid some mistakes done
because of lack in patience and/or wrong beliefs.
I
will try to make it as much clean as possible so to be used and or
tested by anyone who reads. Of course, a base knowledge about price
behavior and price action between supply/demand areas is much welcome.
Timeframe
The
strategy is developed in a combo of H4 and M15. Reading price
fluctuations in H4 is quite comfortable, and you are not required to
stay glued on the monitor the whole day/night. Furthermore,
opportunities become great when reading them in the 15minutes to reduce
the risk.
Indicator
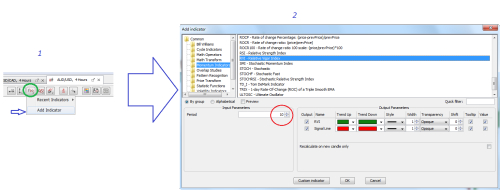
I am using the RVI indicator. In the image below you see how to apply it to a Jforex chart:
The indicator measures the energy (vigor) of a move (R.V.I. = Relative Vigor Index)
by comparing the close price with open, relatively to its range.
Basically, what you expect is the indicator to rise in a bullish trend
because the closing of a candle is higher than the opening and opposite
in bearish trends. So when the energy (vigor) starts to decrease, could be signaling an imminent shift in trend, which actually is the most important thing a trader has to take care of.
Here you see how it appears applied to a forex spot price chart (USD/JPY). Although the default setup has a 10 periods look-back, I set it as 5 periods.
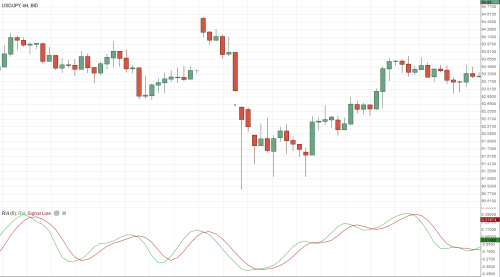
The signal line (red) acts as a weighted moving average.
THE STRATEGY
Here
we come to the application in order to find good entry and exit
position. As I said earlier, it is required to use a combo between 2
different timeframes. The reason in very simple: what you want is to
reduce the risk as much as possible.
Lows/highs
The
most simple way to use this indicator is by recognizing possible
extreme levels to buy/sell any instrument. Studying it in h4 chart gives
much confidence.
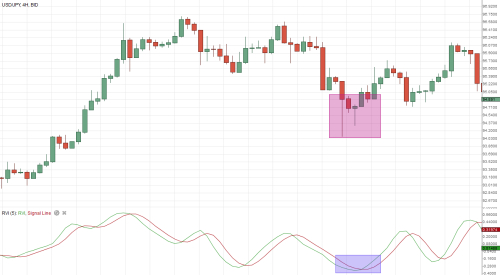
In this chart, you see a recent price action in USD/JPY spot price:
As
you can see, price is coming down from a recent peak. When in the
purple area, price is somehow bottoming and shows clear rejects into an
important support (previous resistance), and the indicator shows a
good exhaustion signaling a possible shift upward. At this point we
could already open a long position to target near 96 with a stop loss
under 94, but this requires a lot of risk, and the reward is not
compensating. Time to switch into M15 timeframe.
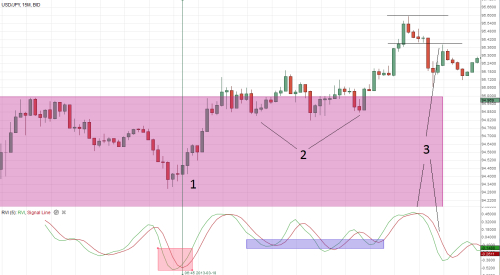
It’s the very same chart and the whole purple area is the one drawn in H4. Here we find 2 great opportunities:
1. Price bottoming near 94 showing important exhaustion in RVI (green vertical line);
2. RVI showing great (bullish) divergence with price;
Since
the H4 shows the possibility for price to rise, what you want to look
for, is a long position. In this case first entry is (1) near 94.40 with a stop below 94.25 (15pips). The second entry is in (2) the divergence area near 94.90 with a stop loss below 94.70 (20pips).
According to h4 setup we know the possible target comes near 96 levels
so we have the opportunity to target about 150 + 70 pips, by risking 15 +
20 but in this case price found a top near 95.60, showing good reasons (3) to exit the trades near 95.40: total of 115 + 60 pips.
Divergences
Another
way to use this indicator is by reading possible divergence with price,
as anticipated in previous paragraph. This is not simple and requires
more knowledge about the different scenarios happening. After a bit of
study and maybe some attempts with a demo account, things become clear
in 2-3 weeks.
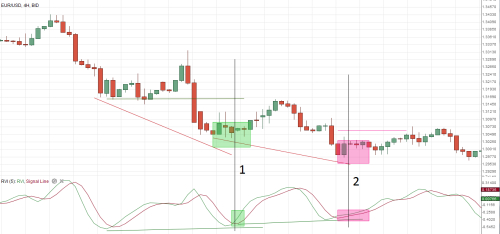
Here an example of 2 consecutive
bullish divergences: price going down and printing new lows, while
indicator crossing at higher-low rates.
As
I wrote at the beginning of the article, a bit of knowledge about price
action and supply/demand is required, so in this case you MUST know price is in downtrend, so opening a long position is risky.
Long opportunity comes in (1): price
prints a lower low, while indicator shows and higher low and cross-up
to suggest possible shift in trend. Entry comes near 1.3070, SL 3040 (most recent low) target 1.3150 (previous low). Same scenario in (2) the only difference is in price level.
In this example I shown how to use the indicator to recognize counter trend entries.
As experience teaches, we have to become able to recognize such
situations, in order to take profits in our trend-trades or in order to
wait a better entry following trend. What I mean is better seen with the
next chart.
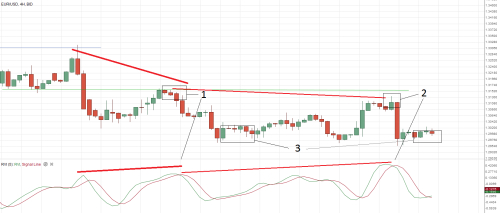
Let’s say you are screening this (or any other) instrument and you see price falling in the first move down (left of picture)
but you were not short for many reasons. The first impulse is to jump
in the trade. You already know how much this is damaging. According on
what shown in previous paragraph, if you want to follow the downtrend,
you will be considering the bullish divergence as “wait patiently price to reach previous support” because this could happen… or not.
In this case it happened in (1):
price hitting previous support, and RVI showing bearish divergence in
H4 and exhaustion for possible shift. Entry short 3140 stop loss 3165
(25pips) target 3030 (most recent low) so about 110pips. Assuming you
decide to hold the trade short for many reasons, then take profits come
when price reach (3) and shows the bullish divergence again. Same situation happens in (2).
More about divergences
The
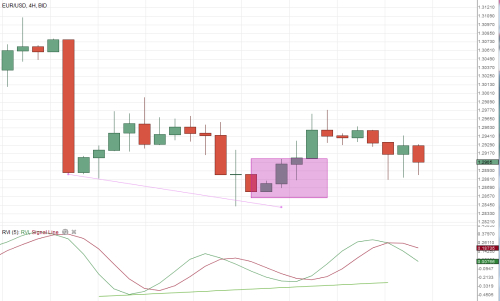
topic deserves a deeper observation. Here another clean example of
bullish divergence in EUR/USD spot price seen in H4 timeframe.
The
purple area indicates where and when we can be more confident in
opening a long position to follow the energy in the move to target most
recent high (1.30). Guess what’s happening in m15?
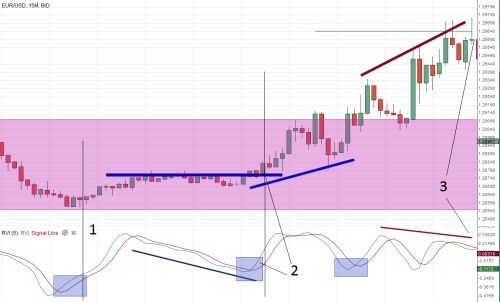
On the left (1)
we see price bottoming in 1.2860, RVI indicates us a possible shift
upward and we know about the h4 bullish divergence to give target area
near 1.30: long position with stop under 2860 (25pips) with a potential target 130 pips.
Going forward (2)
we see the blue powerful bullish divergence. Another long entry is
possible after the RVI shows cross up and price broke the short term
tiny range: entry near 2890 stop loss 2865 (25pips) target 1.30. Reasons
to exit the trade long happen in (3): price prints higher
highs but RVI shows exhaustion and prints lower highs. Total profits
collected about 100 + 60 with a risk of 25.
Time and timing
Did
you want the holy grail? Here it is: learn to be patient and wait a
good setup in a medium term timeframe. Then decide your entries in a
faster one to reduce the risk. The less you risk, the higher the
performance will become! It’s just math. No matter if you have to wait
1-2 or even 3 days for a setup to happen. When happens, be ready to react. Clean your mind, reset your ideas, and live your life. Market will be here also next week, your account could be not.
CONCLUSIONS
All
charts here are based in past price action. Past performance is not
indicative of future results so I will show future results, relatively
to this article, publishing 1 month of trade results at the end of April
2013.
Things are never this easy in markets, so
with next article I will make a presentation of main bad scenarios
happening, and how to avoid them.
Thank you for reading.
Score : http://www.dukascopy.com/fxcomm/fx-article-contest/?A-Powerful-Combo&action=read&id=1275
Subscribe to:
Post Comments (Atom)


Hey Everybody,
ReplyDeleteI've included a list of the most recommended forex brokers:
1. Best Forex Broker
2. eToro - $50 min. deposit.
Here is a list of the best forex tools:
1. ForexTrendy - Recommended Probability Software.
2. EA Builder - Custom Strategies Autotrading.
3. Fast FX Profit - Secret Forex Strategy.
I hope you find these lists beneficial.
Subsequently, after spending many hours on the internet at last We have uncovered an individual that definitely does know what they are discussing many thanks a great deal wonderful post.
ReplyDeletetop forex brokers